The City of Copenhagen’s Smart City incubator, Copenhagen Solutions Lab, have just finished a pan-European project with the aim of developing digital tools that can support the authorities’ decisions on introducing measures against Corona in the public space. Based on Copenhagen Central Station as case, the project has among other things created a 3D-model, that planners can use for digital testing of what effect potential measures in the city’s public space may have.
In the course of the second half of 2020, Copenhagen Solutions Lab have been a part of the pan-European project “RAPID” (Rapid Prototyping In 3D). The project is a collaboration between University College London, Fraunhofer (Europe’s biggest research institution for Applied Science), Copenhagen Solutions Lab, Profondo, PixelMill, and the Spanish city Sabadell, and is supported by the European Institute of Innovation and Technology, an EU agency under the EU Commission.
The overall aim of the project has been to develop tools that can help planners come up with solutions that comply with the COVID-19 restrictions, so the effect of the measures can be tested digitally before they are physically implemented. Such tools can be used to strengthen the basis for decision, shorten the distance from idea to execution, obtain feedback from citizens early on in the process and through that strengthen the accept of physical measures/interventions which ultimately can lead to lower dissemination and increased trust in it being safe for the citizens to frequent the city.
In Copenhagen the project has worked with Copenhagen Central Station as case and has based on a collaboration with the Danish State Railways gained access to flow-data from the central station that has been used in the following digital modelling.
The results of the project are 3 different digital tools:
- A “Hot Spot Indicator Prototype” that by the use of open data can predict at what time of the day there will be a crowd and therefore a greater risk concerning dissemination, on a given location. You can find it live by clicking here: Hot Spot Indicator Prototype
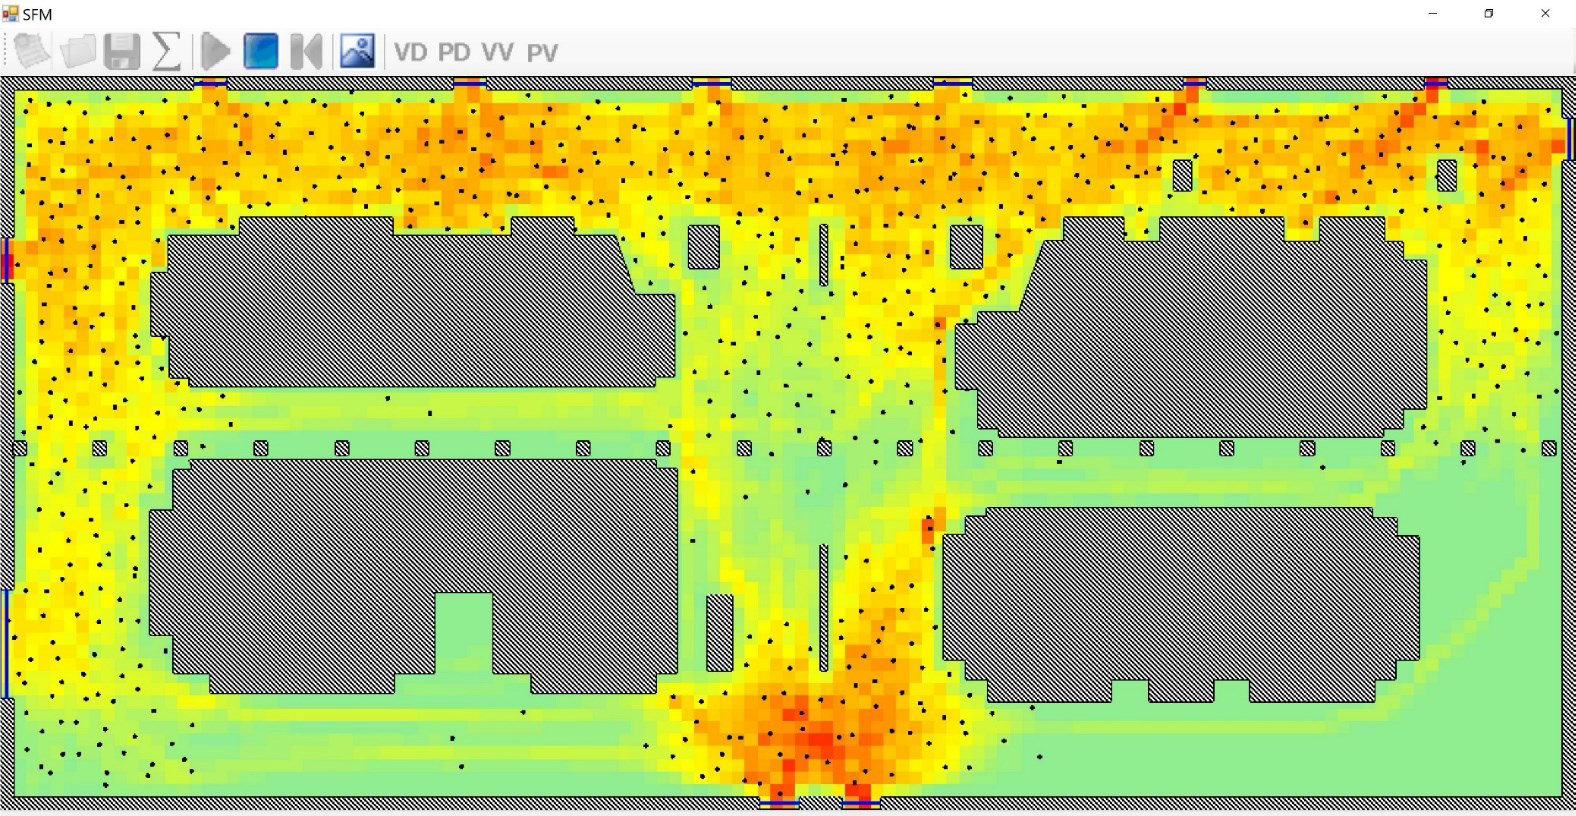
- A 2D-model of the Central Station Hall that by the use of a so-called agent-based modelling can calculate the dissemination by moving through the station hall. The tool can furthermore be used as a visualization tool in relation to identifying places where special measures are necessary, e.g. bottlenecks.
- A 3D-model of the Central Station Hall that makes it possible for planners to test the effect of the different measures on the flow of people and the dissemination. In addition, the 3D-model can be combined with VR-glasses, so for instance citizens can move around in the virtual version of the station hall and provide direct feedback on their surroundings. The development of the 3D-model from the first and relatively simple version 0 to the more detailed and advanced version 1 can be seen on YouTube: Version 0 and Version 1
In connection to the project a virtual 3D-gallery has been prepared, where one can move around using the mouse + WASD-keys on one’s keyboard: FRAME

By Magnus Egelund Thomsen, Copenhagen Solutions Lab